- Published
Sales Analytics for DM Sellers: What Your Chats Hide

Here's a slightly rude question: how many of your customers bought from you twice this year? If you sell in DMs and you can't answer in ten seconds, you don't have sales analytics — you have a chat history. And a chat history is the most expensive database in the world: it holds everything and tells you nothing.

Sales analytics for DM sellers: what the chat hides
Olga runs a small natural cosmetics brand. Sales come from Instagram DMs and a Telegram channel, orders are logged in a Google Sheet "when there's time". Revenue feels fine. Then a slow month hits and she has no idea why.
Everything she needed to know was there — scattered across 900 chats:
- that a third of her revenue came from 40 regular customers, and 11 of them hadn't ordered in three months;
- that her new face oil sold out twice, while the scrub she reordered was gathering dust;
- that the average order from Telegram was almost 1.5× bigger than from Instagram.
None of that is visible in a chat. You can't sort messages by "repeat customer".
Four numbers every DM shop should see
1. Repeat customers
Who comes back, how often, and who stopped. For small shops, regulars are usually the cheapest revenue there is — and the easiest to lose quietly.
2. Average order value
The single lever you can pull without new traffic: bundles, "add a travel size", free delivery thresholds. You can't move what you don't measure.
3. Best and worst sellers
What to reorder and what to stop buying. In a spreadsheet this is guesswork; in a system it's a sorted list.
4. Channel performance
Which channel actually brings money, not just likes. This tells you where to post and what to push.
Where the data comes from (without extra work)
Analytics only works if the data appears on its own. Nobody keeps a perfect log by hand. In datalizeCRM, orders come from the Telegram Mini App storefront, and every tap there leaves a trace. Each order is linked to a customer, items and a channel — so reports build themselves from what already happened. Orders you take in DMs go in with two clicks, into the same base.
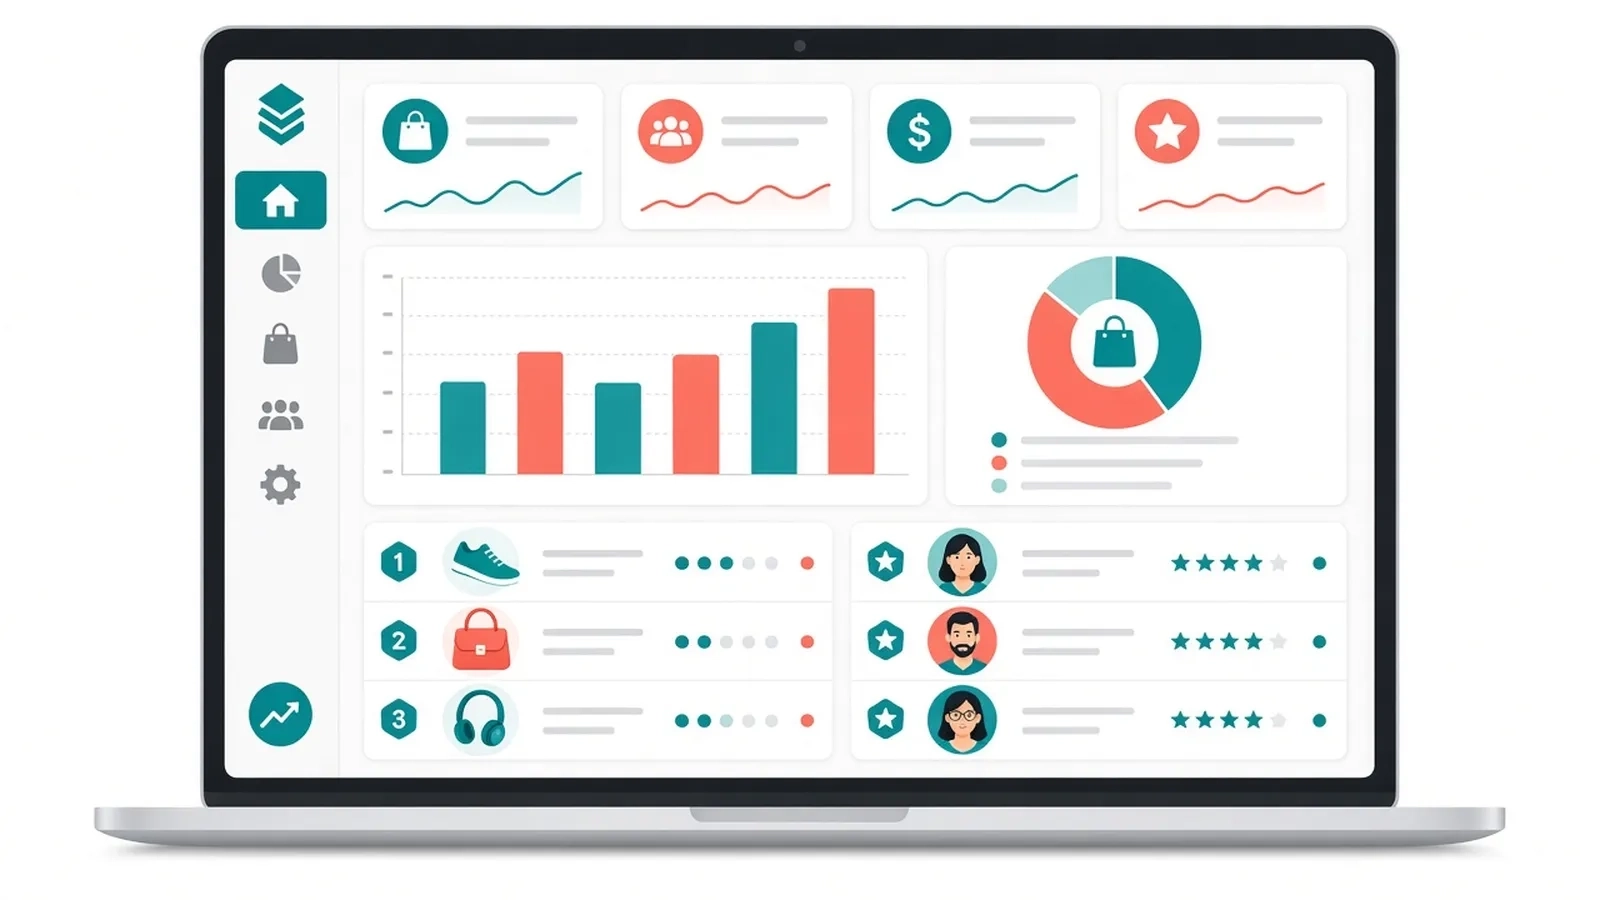
What Olga sees now when she opens the dashboard:
- revenue by week and by channel;
- top-5 products and the ones that haven't moved in 60 days;
- a list of regulars who haven't ordered in 90 days — ready for a personal message and a small discount.
That last list paid back her whole switch in the first week.
From numbers to decisions
- Win back sleeping regulars before chasing new followers.
- Reorder what sells out, stop reordering what doesn't (and keep stock honest — see free vs reserved stock).
- Put your best time into the channel that pays, not the one that's loudest — the logic is the same as in own channel vs marketplace.
Start with the Basic plan of datalizeCRM — it's free forever, with no trial clock.
FAQ
Do I need a lot of orders for analytics to make sense?
No. Even 30–50 orders a month show who your regulars are and what sells.
Will I have to enter data by hand?
Orders from the Mini App arrive automatically. DM orders take a couple of clicks.
Is this a replacement for my spreadsheet?
Yes — read what order tracking in Google Sheets really costs and CRM vs Excel for chat orders.